
Ajibola Ayomide
Odeyemi
Quantitative Data Analyst | AI-Integrated Data Specialist
Transforming complex, multi-variable datasets into actionable business intelligence with 3+ years of professional expertise.




OPTIMIZED
DEPLOYED
MAINTAINED
 Active Data and
Business Analyst
PROJECT PORTFOLIO
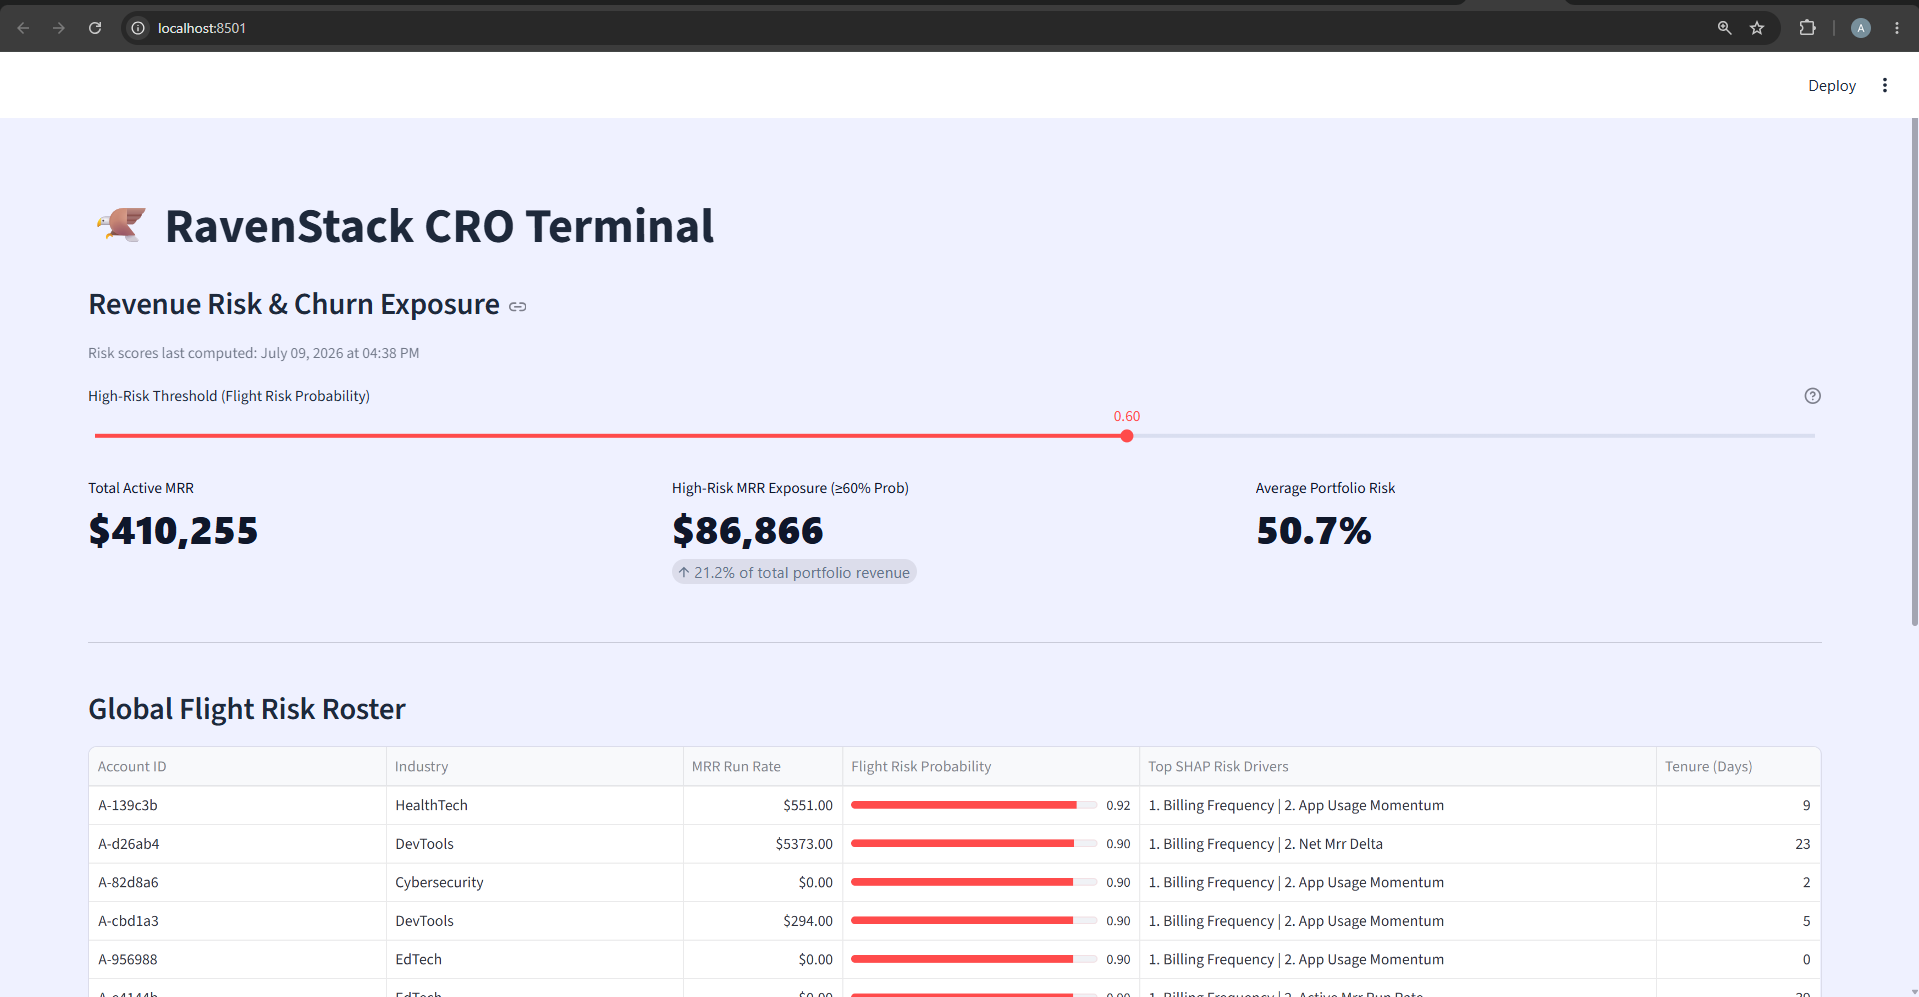
RavenStack — Enterprise Retention Risk Engine
End-to-end SaaS churn analytics platform — MySQL data pipeline, Tableau executive dashboard, and a LightGBM machine learning model with a Streamlit app to flag at-risk customers before they cancel.
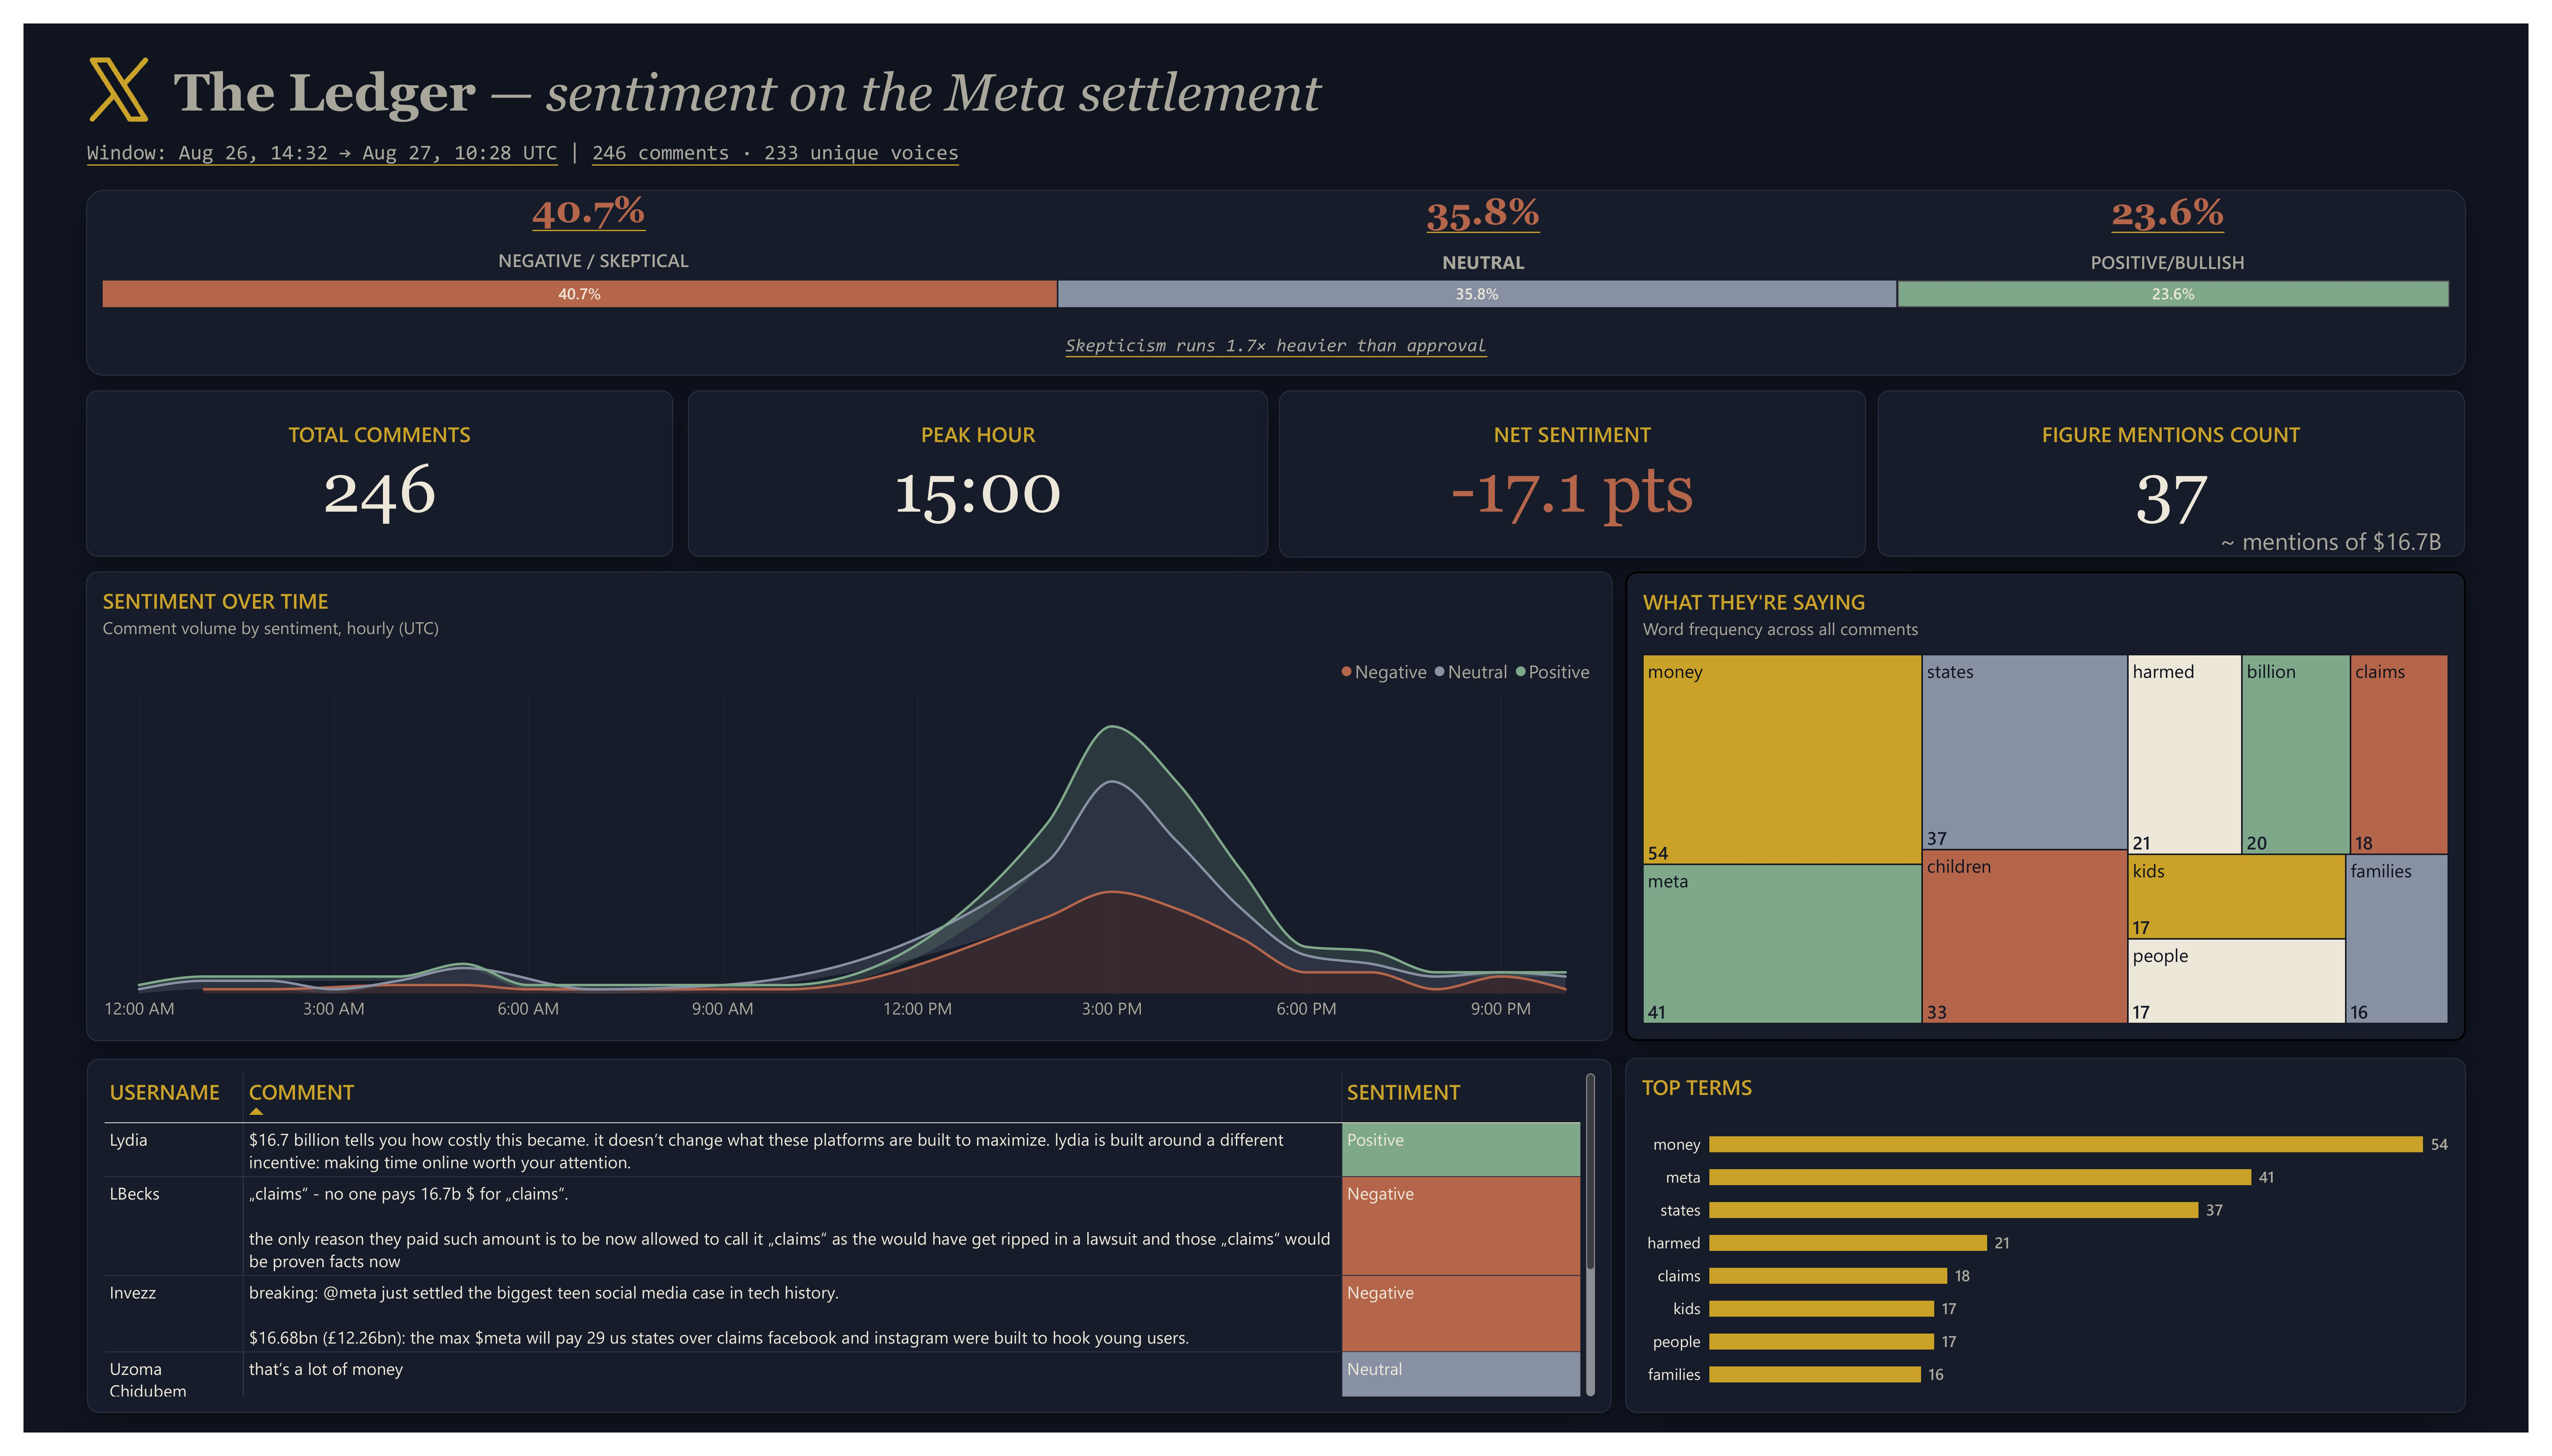
Meta $16.7B Settlement Twitter Sentiment & Data Extraction Pipeline
End-to-end NLP data pipeline and Power BI analytics dashboard for automated Twitter/X data extraction and sentiment evaluation surrounding Meta's $16.7B legal settlement. Integrates scalable Twitter ingestion scripts, VADER sentiment scoring, M-code text normalization, and advanced DAX data modeling.
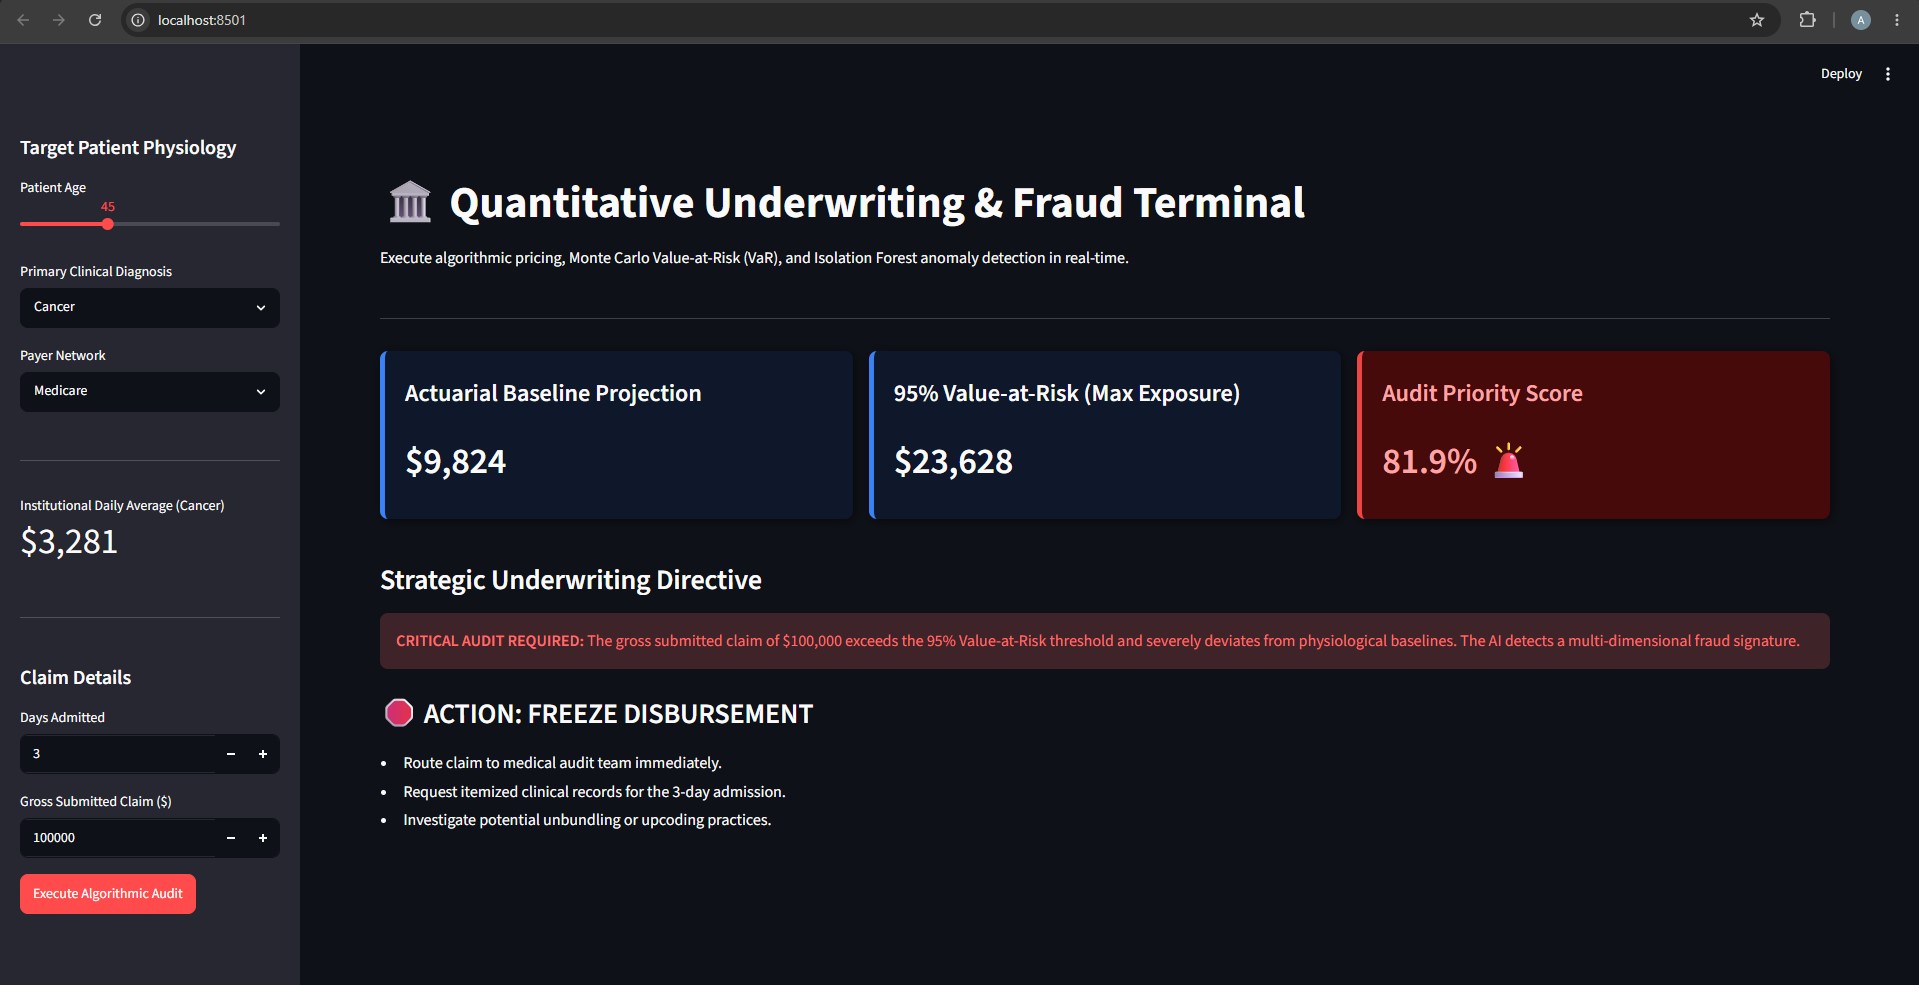
QUANTITATIVE ACTUARIAL VaR & FRAUD DETECTION ENGINE
End-to-end MLOps pipeline on 55k+ records. Engineered SQL Window Functions, regularized XGBoost pricing, 10k-iteration Monte Carlo VaR simulations, and an Isolation Forest model to detect billing anomalies via a decoupled Streamlit UI.
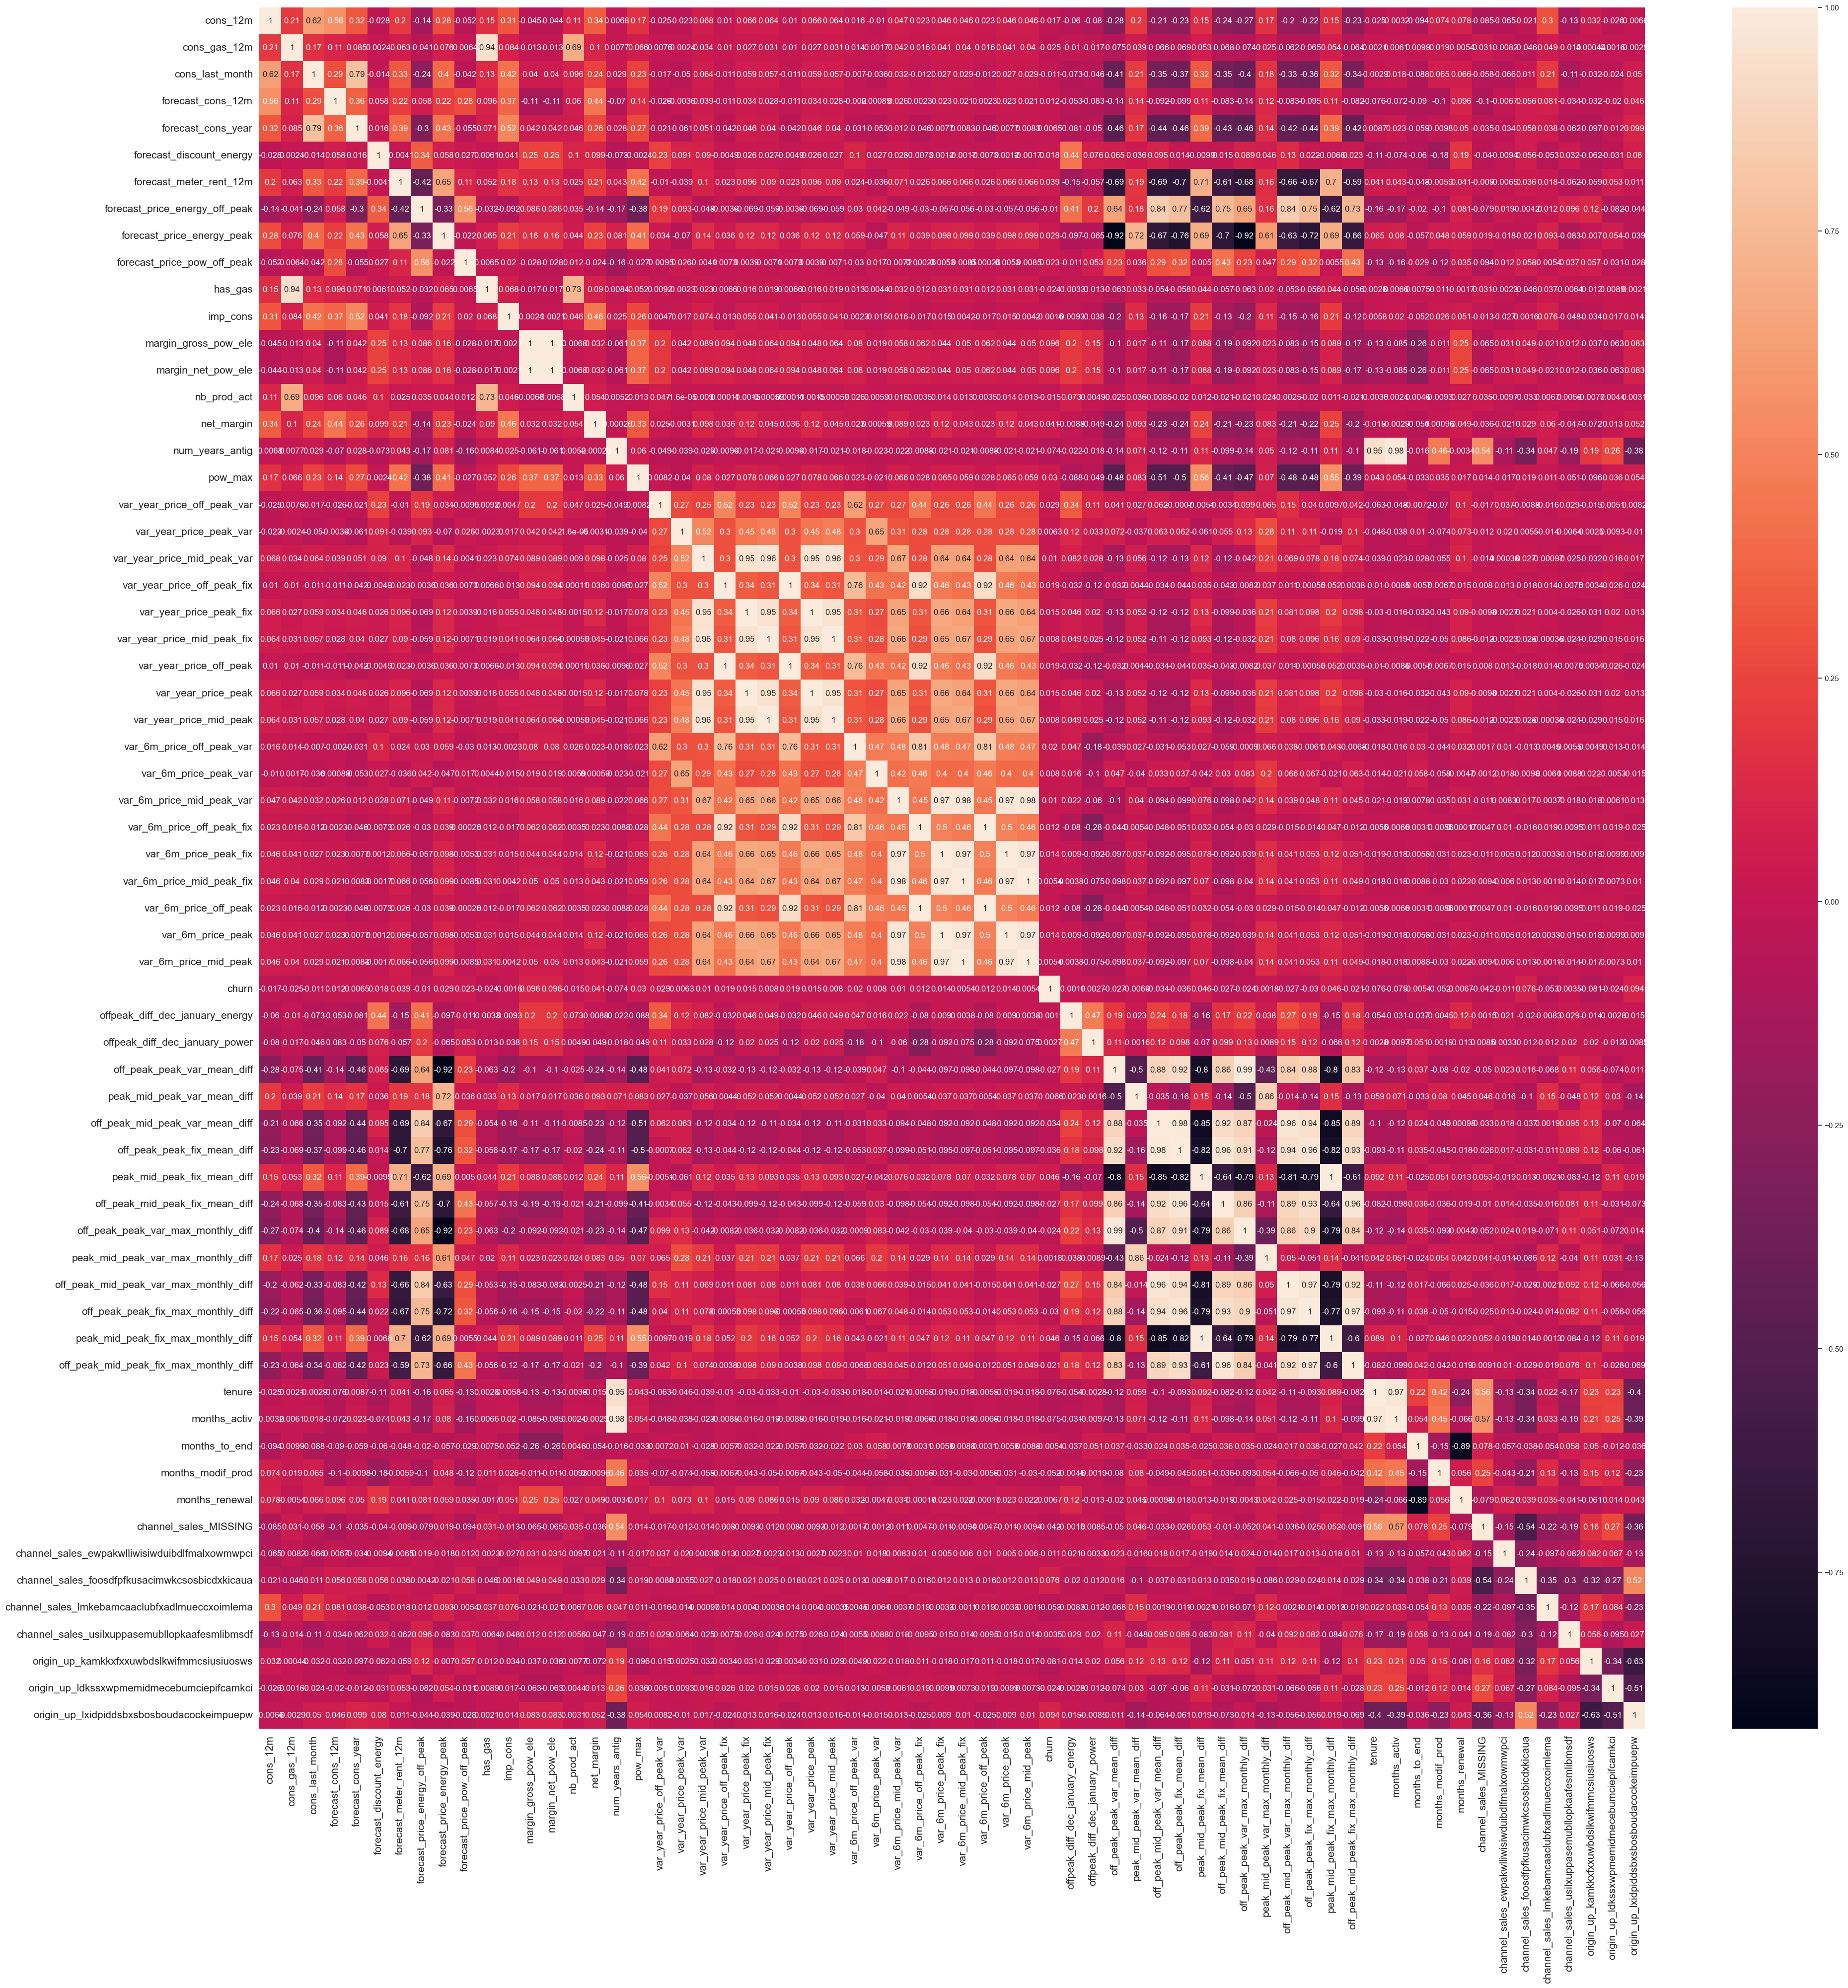
BCG SME Energy Churn Analytics & Predictive Modeling
End-to-end customer churn prediction & price sensitivity analysis for BCG PowerCo simulation. Features engineered tariff metrics, Random Forest modeling (~0.82 precision), and an actionable 20% discount strategy via the SCQA framework to boost SME retention. Built with Python, Pandas, & Scikit-Learn
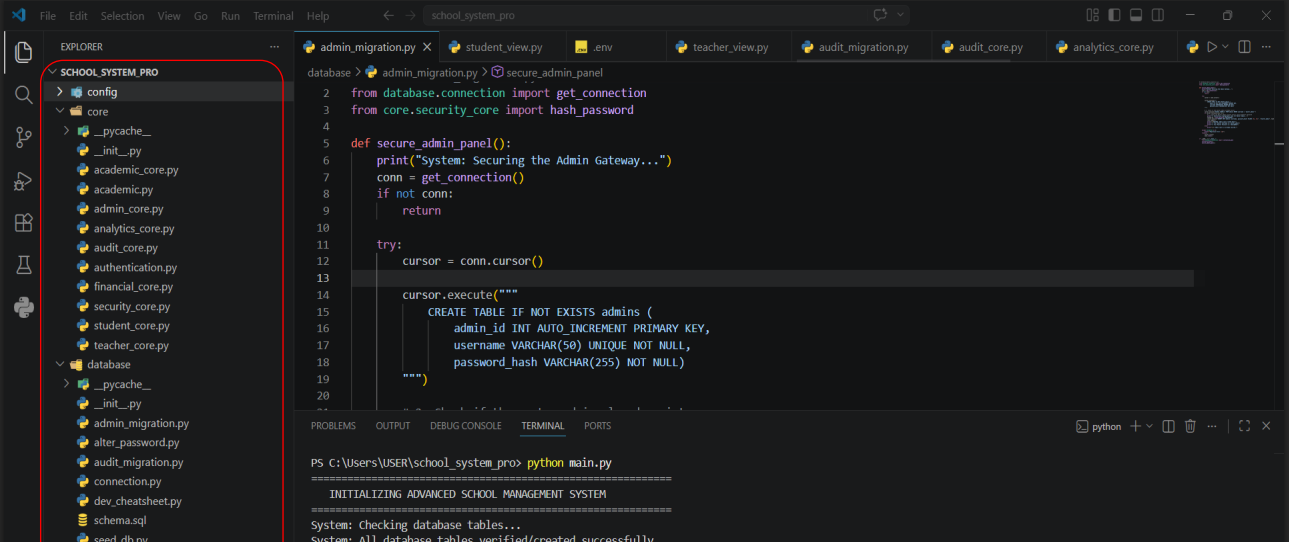
SECURE INSTITUTIONAL DATABASE SYSTEM
MySQL, bcrypt security, connection pooling, role-based access. Enterprise-grade architecture separating business logic from database UI views.
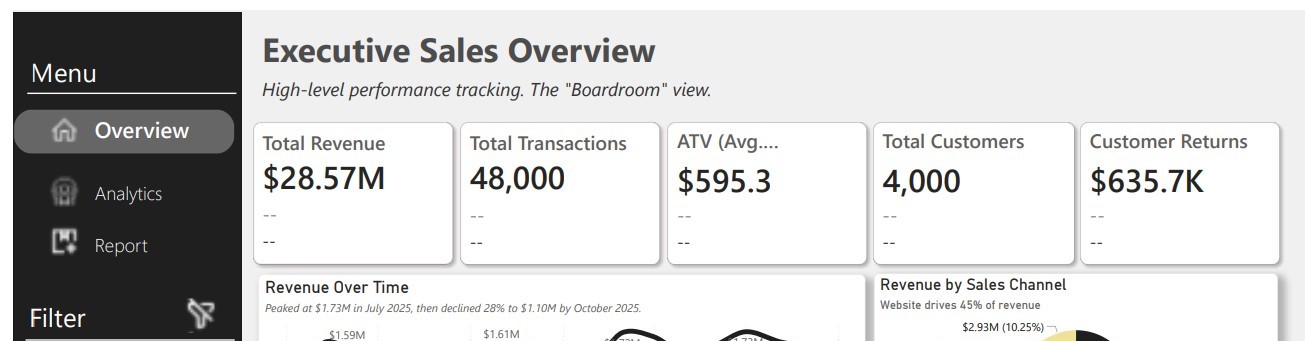
GLOBAL SOFTWARE SALES PERFORMANCE ENGINE
An interactive Power BI dashboard utilizing a Star Schema and dynamic DAX to analyze 50k+ records. Built to track customer loyalty, billing efficiency, and revenue optimization.
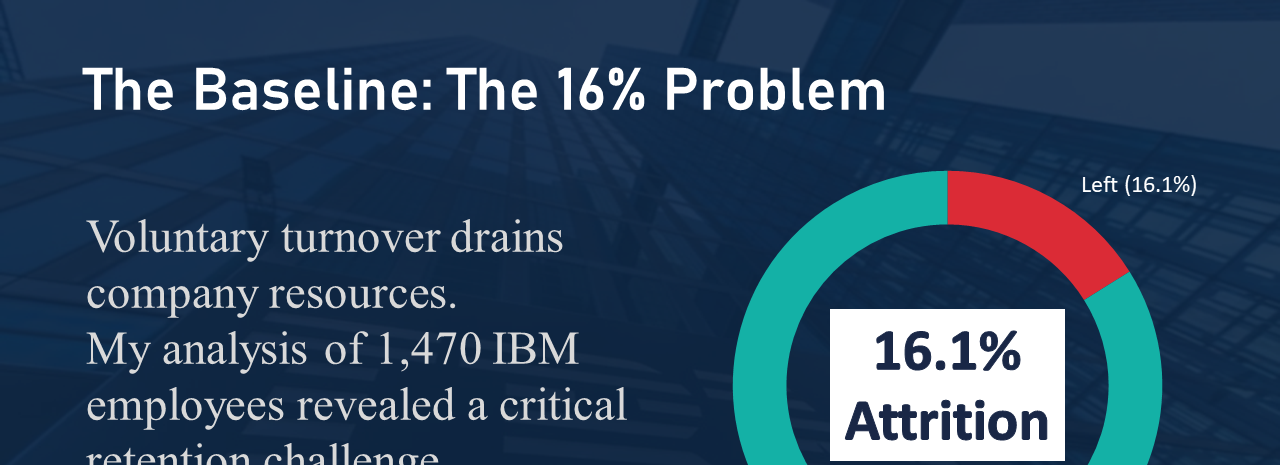
SPSS HR ATTRITION DRIVERS ANALYSIS
IBM SPSS HR database analysis using independent T-tests. Identified statistically significant 24-month flight risk spikes, a $2k income gap, and heavy commute fatigue.
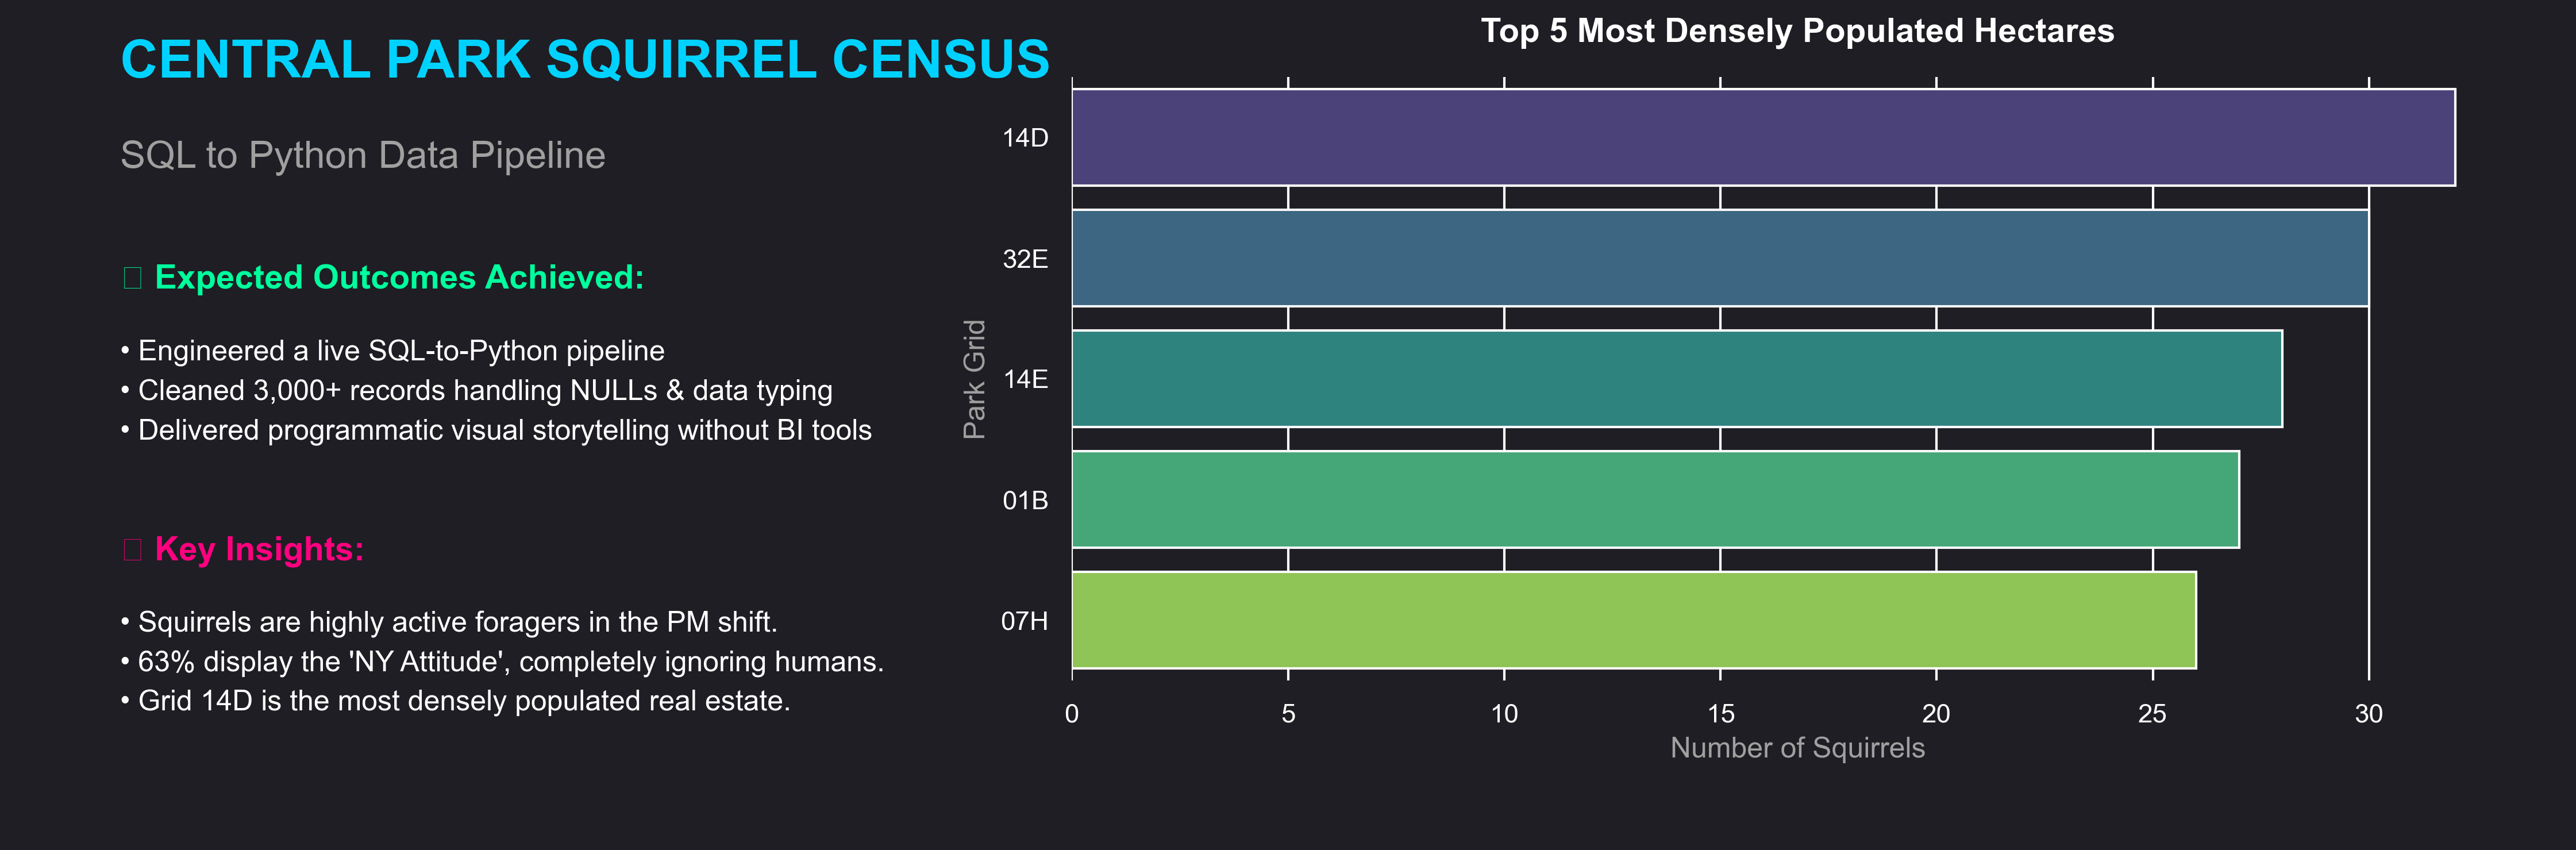
SQL CENTRAL PARK SQUIRREL DATA PIPELINE
MySQL backend, Python/Pandas extraction, Seaborn mapping visualization. Behavioral tracking. Handled messy string dates and boolean conversions programmatically.
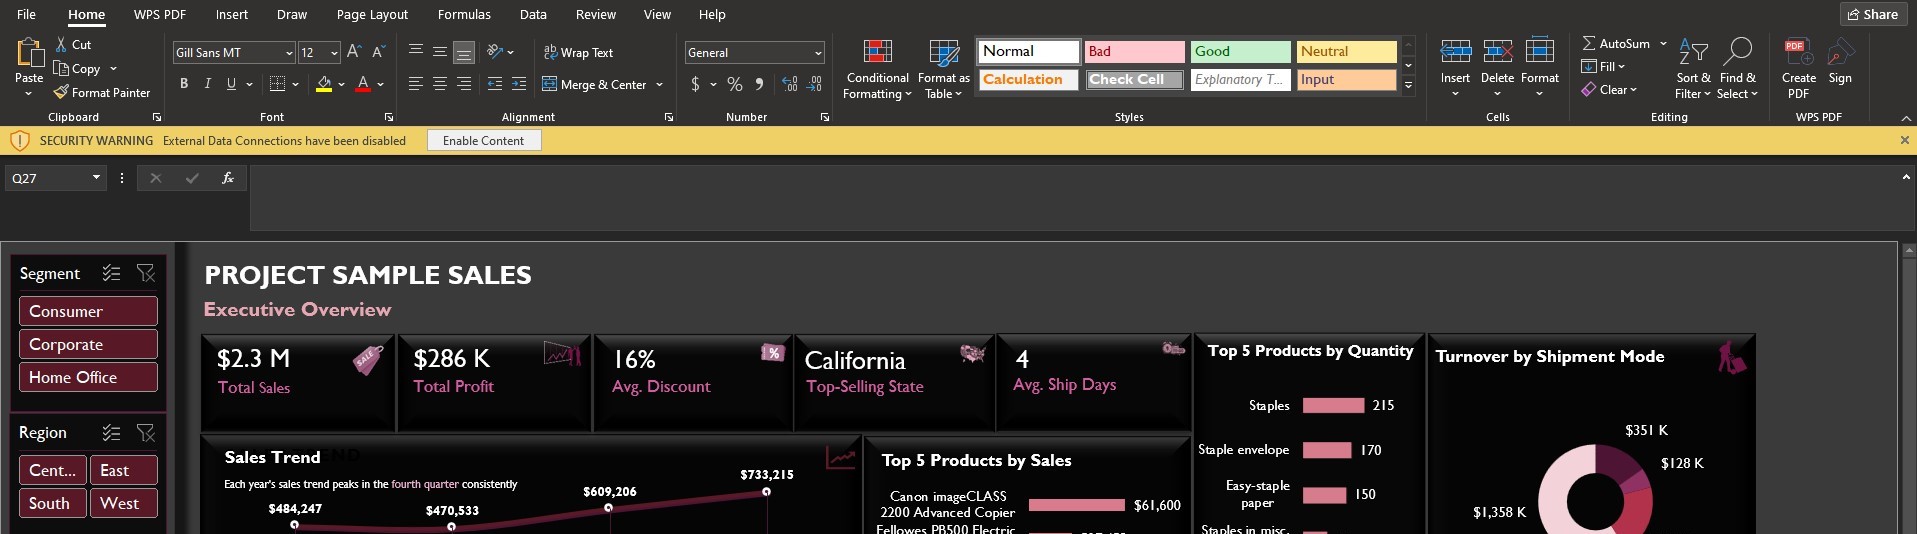
ENTERPRISE COMMERCIAL ANALYTICS ENGINE
An end-to-end commercial analytics engine built in Excel. Features rigorous ETL processing, dimensional data modeling, and dynamic KPI dashboards.
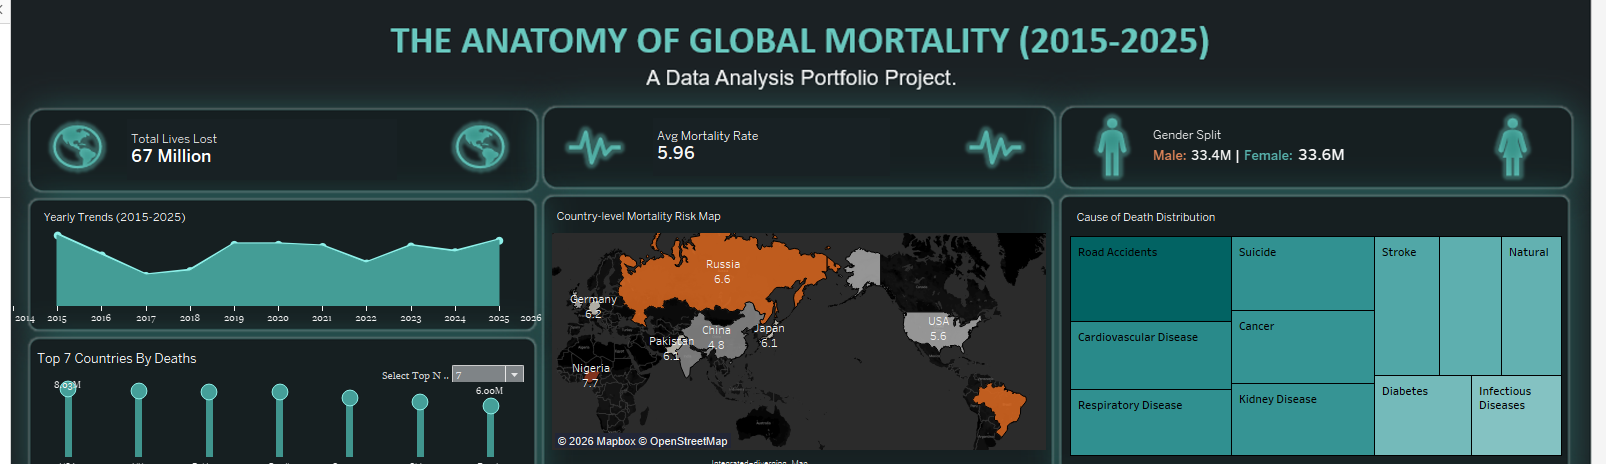
THE ANATOMY OF GLOBAL MORTALITY (2015-2025)
An interactive Tableau dashboard analyzing a 10-year dataset of global mortality trends. Utilizes advanced data storytelling to map demographic vulnerabilities.
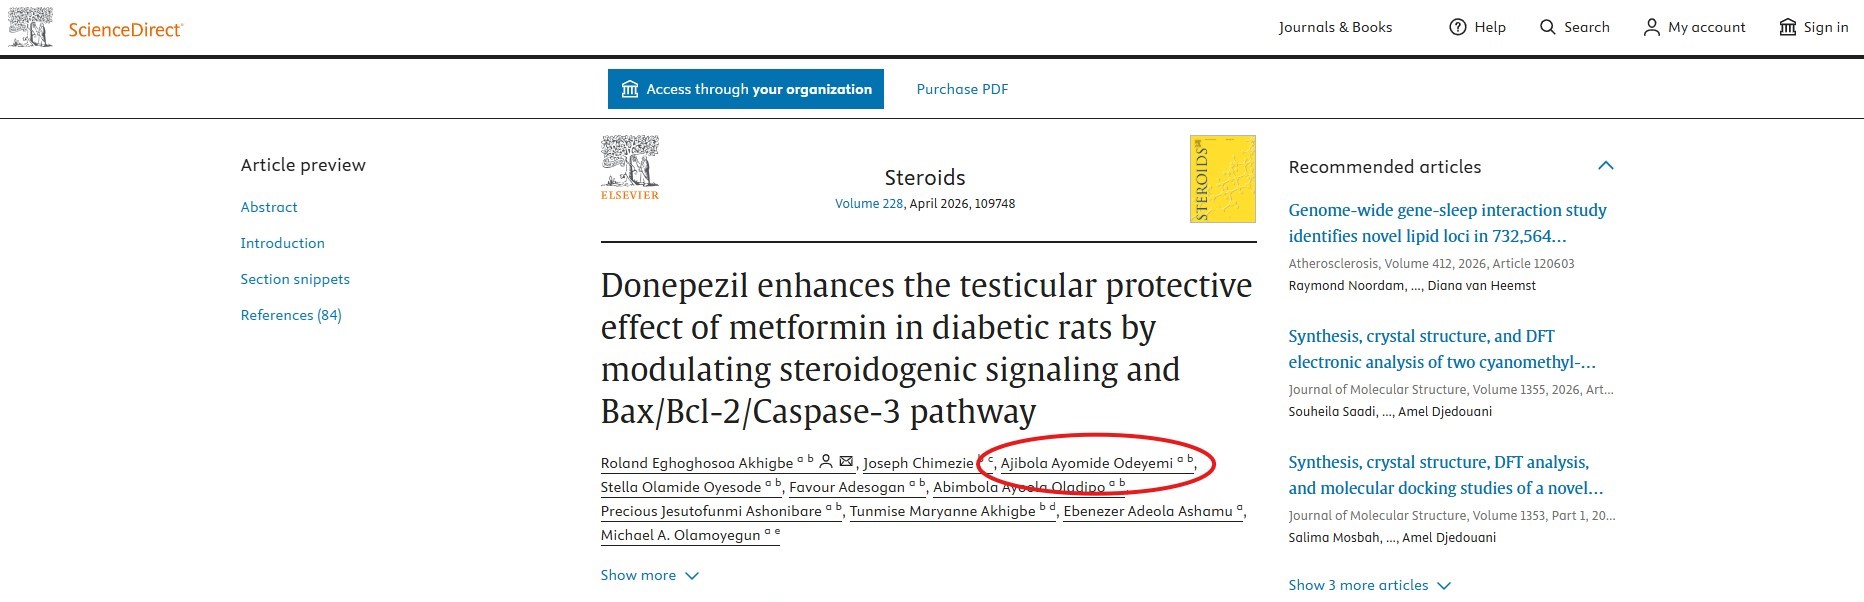
QUANTITATIVE RISK MODELING & BIOMEDICAL RESEARCH
Elsevier, Vol. 228 publication. Executed formal data analysis, sample sizing via G*Power, and 2-way ANOVA in GraphPad Prism alongside project administration and manuscript editing. The study demonstrates that combined metformin-donepezil therapy synergistically protects against diabetic testicular injury.
BIOMEDICAL REVIEW & CELLULAR RESEARCH
Frontiers, Vol. 14 publication. Led project administration, original draft writing, and manuscript editing for a comprehensive review on mitochondrial signaling and dysfunction. The paper bridges mitochondrial pathways with targeted therapies like gene editing and organelle transplantation.